Introduction: A Database of Projects Is Not Proof of a Transition
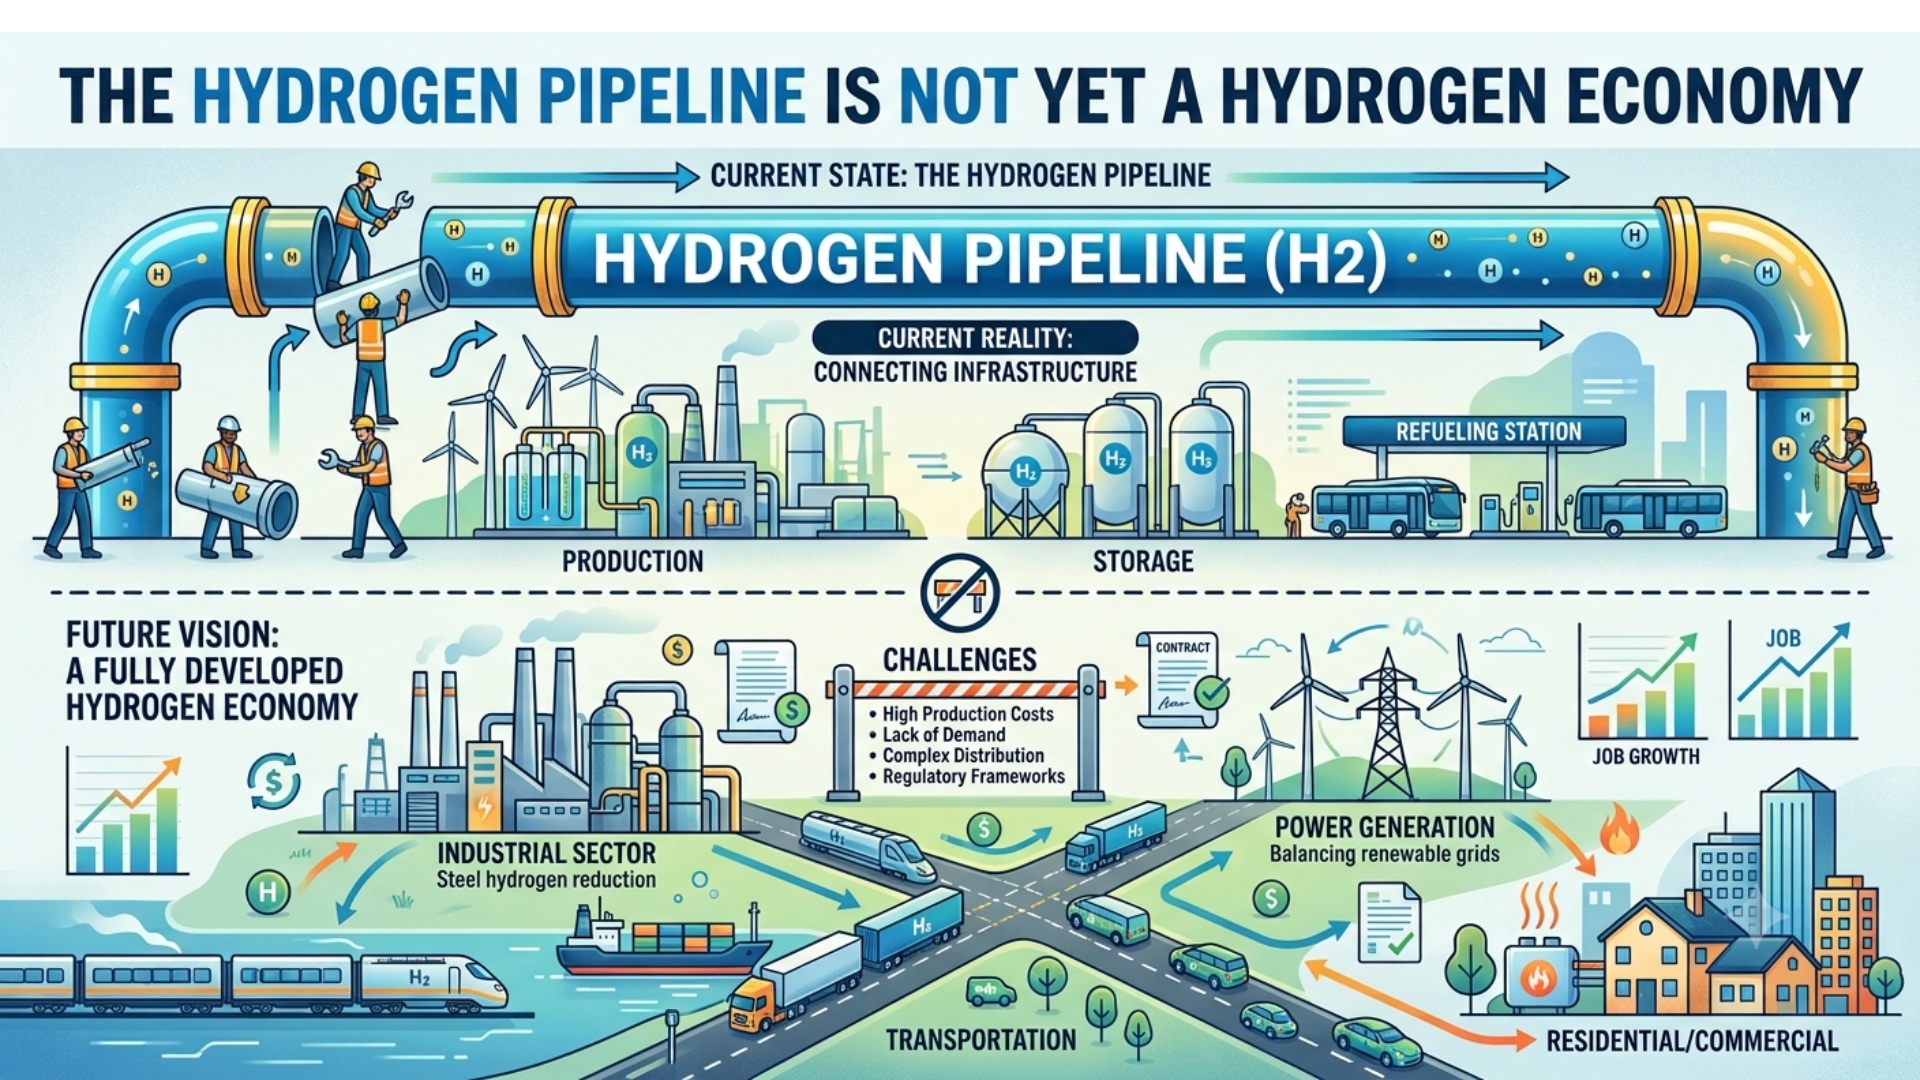
The International Energy Agency’s Hydrogen Production and Infrastructure Projects Database is an important attempt to organise the rapidly expanding landscape of hydrogen projects.
The database covers hydrogen-production projects commissioned worldwide since 2000, together with projects that are under construction or still being planned. It also tracks hydrogen pipelines, underground storage facilities and import/export terminals intended for low-emissions hydrogen and hydrogen-derived fuels. The database was most recently updated in June 2026 and is scheduled for annual revision.
This makes it a valuable source of information. But it also creates a behavioural risk.
When a database displays hundreds of projects, large production capacities and thousands of kilometres of proposed pipelines, the human mind can easily convert “these projects have been announced” into “this capacity will probably be built”, and then into “a large hydrogen economy is already emerging”. These three statements are not equivalent.
The database records intentions, stages and possibilities. It does not, by itself, prove that all these projects will be financed, completed, operated at high utilisation, supplied with genuinely low-emissions energy or supported by customers willing to pay the required price.
The appropriate question is therefore not: How many hydrogen projects have been announced? It is: What proportion of announced projects will become reliable, commercially sustainable and genuinely low-emissions operating assets?
That is the claim that must be tested.
What Does the IEA Evidence Actually Show?
The IEA’s Global Hydrogen Review 2026 provides the context necessary to interpret the project database.
Global hydrogen demand surpassed 100 million tonnes in 2025. However, almost all this demand continued to come from traditional applications in refining and industry. Low-emissions hydrogen production was close to only 1 million tonnes, despite growing by approximately 20% during the year.
This means that low-emissions hydrogen still represented roughly 1% of total hydrogen production.
The IEA reports that the pipeline of announced low-emissions hydrogen production projects for 2030 has declined to around 27 million tonnes per year because of cancellations, pauses and postponements beyond 2030. Projects that have already reached committed investment stages account for approximately 4.3 million tonnes. That might rise above 6 million tonnes if projects considered to have strong potential reach final investment decisions during 2026 or 2027.
The difference between 27 million tonnes of announcements and 4.3 million tonnes of committed production is not a minor statistical detail. It is the central risk signal.
Almost 22 million tonnes of potential production could lose any realistic opportunity to become operational by 2030 unless investment decisions are taken by early 2027. Therefore, the database should not be read as a forecast of certain production. It is better understood as a collection of projects with widely different probabilities of completion.
The First Cognitive Trap: What You See Is All There Is
A visible project has a name, location, developer, capacity, technology and planned commissioning date. A failed project often has no dramatic public event. It may be quietly postponed, reduced in size, merged into another development or left indefinitely in a pre-investment stage.
This produces a visibility imbalance. The announced projects are easy to count. The missing financing agreements, unresolved permits, weak customers, unavailable grid connections and unproven operating assumptions are much harder to see.
The mind naturally builds a coherent story from the information that is most readily available:
- Electrolyser capacity has been announced.
- A government has published a hydrogen strategy.
- A port has proposed an ammonia terminal.
- A developer has declared a 2030 commissioning date.
- Therefore, a hydrogen market appears to be forming.
But the absent information may be more important:
- Is the electricity supply contract firm?
- Is the renewable power genuinely additional?
- Has the customer signed a binding take-or-pay agreement?
- Who accepts the cost difference against conventional hydrogen?
- Has the project secured debt financing?
- Are the pipeline and storage assets ready on the same schedule?
- Does the project retain acceptable economics after cost escalation?
- What happens if subsidies, carbon prices or mandates change?
A project database can show what has been announced. It cannot automatically show everything that must remain true for the project to survive.
The Second Cognitive Trap: Base-Rate Neglect
Every large industrial project has a unique narrative. Developers emphasise favourable renewable resources, strategic locations, government support, experienced partners and future demand.
However, project evaluation should begin with the base rate: What percentage of hydrogen projects at this development stage historically reach commercial operation on their original capacity, cost and schedule?
An announced project without permits, financing or firm offtake should not receive the same evidential weight as a project under construction. Yet aggregated headline figures can unintentionally place them in the same mental category.
A more reliable classification would separate the pipeline into an evidence ladder:
- Concept announcement
- Pre-feasibility study
- Front-end engineering
- Land, water and grid rights secured
- Environmental and regulatory approvals secured
- Binding offtake agreement executed
- Financing closed and final investment decision reached
- Construction started
- Commissioning completed
- Stable commercial operation demonstrated
A project at Stage 2 should not be counted as though it were merely waiting to become Stage 10. It may need to survive eight separate failure gates.
The Third Cognitive Trap: Anchoring on the 27-Million-Tonne Pipeline
Large numbers become anchors. Once readers see an announced 2030 production pipeline of approximately 27 million tonnes, subsequent discussion tends to revolve around that number.
But the IEA’s stronger evidence is the much smaller committed figure of around 4.3 million tonnes. Even including projects with strong potential raises the total only to slightly above 6 million tonnes.
The 27-million-tonne number represents an upper boundary of declared ambition, not a central estimate of delivered output.
A better approach would assign probability weights to each development stage. For example:
- Announced concept: 5–15% probability
- Feasibility or engineering stage: 15–35%
- Permitted with preliminary offtake: 35–55%
- Final investment decision: 70–90%
- Under construction: 85–95%
- Commissioned and operating: measured rather than forecast
These ranges would differ by country, technology and market, but even imperfect probability weighting would be more informative than treating every announced tonne equally.
Capacity multiplied by probability of delivery is more meaningful than announced capacity alone.
Demand Is the Missing Component
Hydrogen production cannot become commercially sustainable merely because an electrolyser has been installed. Someone must purchase the hydrogen at a price that covers:
- Electricity and water treatment
- Electrolyser capital recovery
- Compression, storage and transportation
- Conversion into ammonia, methanol or synthetic fuel
- Reconversion losses, where applicable
- Maintenance and stack replacement
- Financing and insurance
- Certification and compliance costs
The IEA reports that new low-emissions hydrogen offtake agreements remained at approximately 1.7 million tonnes per year during 2025. Only about one-fifth of the newly signed volume was supported by firm contractual commitments.
Therefore, approximately 80% of the newly announced offtake volume was not yet supported by the strongest form of customer commitment. This is a significant falsification signal.
If strong demand already existed, we would expect to see:
- Binding long-term purchase agreements
- Take-or-pay obligations
- Creditworthy customers
- Clear price-indexation formulas
- Allocation of carbon-credit and certification risks
- Penalties for failure to supply or purchase
- Customers accepting at least part of the green premium
Expressions of interest and memoranda of understanding may indicate curiosity. They do not necessarily establish bankable demand.
The Cost Claim Must Also Be Tested
The commercial problem cannot be solved simply by forecasting lower electrolyser prices.
The IEA concludes that, without policy support, the maximum acceptable hydrogen price is below USD 2 per kilogram for most combinations of regions and applications. Even with incentives, the cost gap remains open in most sectors and regions.
The IEA also expects fossil-based hydrogen to remain less expensive than renewable hydrogen in most regions in the near term.
This produces an uncomfortable question: Is the emerging hydrogen industry creating a self-sustaining market, or is it creating production capacity whose survival depends on continuing policy support?
Government support may be justified where it creates learning, lowers future costs or reduces important externalities. But dependence on support must be measured transparently.
A project should be stress-tested under at least four conditions:
1. Expected subsidy case
2. Reduced subsidy case
3. Delayed subsidy-payment case
4. No-subsidy commercial case
The project should also be tested against higher interest rates, lower electrolyser utilisation, power-price escalation, stack degradation, construction delays, water constraints, lower carbon prices, customer renegotiation, foreign-exchange movements and changes in certification rules.
A project that survives only under a single optimistic policy and cost scenario is not robust. It is fragile.
Infrastructure Announcements Carry the Same Risk
The infrastructure database covers pipelines, storage and import/export terminals. But announced infrastructure must also be separated from committed infrastructure.
The IEA identifies more than 40,000 kilometres of announced hydrogen pipelines by 2035. Only around 9% of that length is operational or supported by committed investment.
Announced underground hydrogen storage could provide approximately 11 TWh of capacity by 2035, but only slightly more than 7% has reached a final investment decision or entered construction.
This creates a system-interface risk.
- A production project may be completed while the pipeline is delayed.
- A terminal may be constructed before sufficient export demand exists.
- A storage cavern may be developed without adequate throughput.
- An offtaker may be ready while production remains constrained by grid availability.
Each individual project may appear reasonable when examined separately. The complete system can still fail because the interfaces do not mature together. This is why hydrogen development must be assessed as a connected system rather than as a collection of isolated assets.
Transportation Can Consume a Significant Part of the Energy
Hydrogen is not a primary energy source. It is an energy carrier that must be produced, conditioned, transported and sometimes converted into another material.
Where pure hydrogen is required after maritime transport, the IEA estimates minimum transportation and conversion costs of around USD 2 per kilogram of hydrogen. Liquefaction or reconversion can use more than 10 kWh per kilogram—more than 30% of hydrogen’s energy content.
This does not mean hydrogen trade is impossible. It means that distance, conversion route and final application matter.
The relevant comparison is not merely green hydrogen versus grey hydrogen. It may instead be:
- Direct electrification versus hydrogen
- Local hydrogen versus imported ammonia
- Battery storage versus hydrogen storage
- Conventional steel plus carbon controls versus hydrogen-based steel
- Renewable electricity exported through a grid versus converted into hydrogen
- Domestic fertiliser production versus imported low-emissions ammonia
Hydrogen should be selected where it offers the strongest system-level advantage—not merely where its use is technically possible.
The Emissions Label Must Be Falsifiable
A project described as renewable, clean or low-emissions should not receive that classification permanently on the basis of its intended technology. The emissions outcome depends on operating conditions.
For electrolytic hydrogen, important variables include:
- Actual hourly electricity source and grid carbon intensity
- Renewable-energy additionality and curtailment assumptions
- Electrolyser utilisation
- Compression, storage and water-treatment energy
- Conversion, reconversion and transportation distance
- Equipment manufacturing and replacement
For hydrogen produced from natural gas with carbon capture, additional variables include:
- Upstream methane leakage
- Actual carbon-capture rate
- Capture during start-up and partial load
- Electricity and steam source
- Carbon transportation and storage permanence
- Venting and maintenance events
The IEA itself observes that high-capture CCUS-based hydrogen production has not yet been demonstrated at the required commercial level. Therefore, “low-emissions” should be treated as a performance claim requiring continuous verification—not as a permanent colour assigned to a production pathway.
A Falsification Framework for Hydrogen Claims
Claim 1: Announced projects indicate future production
Falsification test: Track the percentage of announced capacity that reaches investment decision, construction and stable operation within the declared schedule.
Failure evidence: Repeated postponements, capacity reductions, cancellations or indefinite pre-investment status.
Claim 2: A strong market for low-emissions hydrogen is emerging
Falsification test: Measure the proportion of production supported by binding, creditworthy and long-term offtake contracts.
Failure evidence: Continued dependence on non-binding memoranda, short-term tenders or customers unwilling to accept the price premium.
Claim 3: Low-emissions hydrogen is becoming commercially competitive
Falsification test: Compare the full delivered hydrogen cost against the incumbent alternative after including financing, transport, storage, conversion and replacement costs.
Failure evidence: Projects remain viable only with permanently increasing subsidies or mandates.
Claim 4: Hydrogen projects materially reduce emissions
Falsification test: Measure audited lifecycle emissions during actual operation.
Failure evidence: Grid electricity, methane leakage, low carbon-capture performance or conversion losses push lifecycle emissions above the certification threshold.
Claim 5: Hydrogen infrastructure will enable a functioning market
Falsification test: Compare the commissioning dates and utilisation of production, pipelines, storage, terminals and customer facilities.
Failure evidence: Persistent interface delays, low infrastructure utilisation, curtailment or stranded production capacity.
Claim 6: Hydrogen improves energy security
Falsification test: Examine whether the system reduces concentration, import exposure and price volatility under realistic disruption scenarios.
Failure evidence: Dependence merely shifts from imported natural gas to imported ammonia, specialised equipment, critical materials, shipping routes or foreign subsidies.
A Hydrogen FMEA Approach
The project database could become more useful when interpreted through a living risk-management system.
| Potential failure mode | Hidden mechanism | Early warning indicator | Required action |
| Project never reaches investment decision | Weak economics or uncertain policy | FID repeatedly postponed | Downgrade probability and review assumptions |
| Offtake does not become bankable | Customer refuses price premium | Non-binding agreements dominate | Require creditworthy take-or-pay contracts |
| Production is not genuinely low-emissions | Grid power or methane leakage raises emissions | Certification assumptions differ from operations | Conduct periodic lifecycle-emissions audits |
| Infrastructure arrives late | Poor coordination across interfaces | Pipeline, terminal and plant schedules diverge | Maintain integrated interface risk register |
| Cost exceeds business case | CAPEX, electricity or interest rates increase | Revised cost estimate exceeds contingency | Re-run downside economics and establish kill criteria |
| Electrolyser output underperforms | Degradation or low utilisation | Falling efficiency and availability | Monitor stack health and replacement exposure |
| Policy support changes | Subsidy or mandate is delayed | Regulatory milestones slip | Model reduced-support and no-support cases |
| Export market fails to develop | Importer lacks infrastructure or certification | Delayed terminals and absent purchase contracts | Prioritise domestic anchor demand |
| Water or grid access is constrained | Competing local requirements | Permit delays or curtailment | Treat resource availability as a design constraint |
| Correlated project failures occur | Common policy, technology or supplier exposure | Multiple projects delayed simultaneously | Apply portfolio-level concentration limits |
This FMEA must not become a static project document. It should remain a living, ownership-driven system that connects production, power supply, water, storage, transport, customers, certification, policy and financing. Weak signals such as delayed permits, expiring memoranda, revised commissioning dates and changing subsidy rules should trigger immediate reassessment of project probability.
Implications for India
The IEA notes that tenders by the Solar Energy Corporation of India and several refineries have resulted in offtake contracts. However, it also warns that progress will depend on the availability of government incentives, which remained unclear in its assessment.
India has potential advantages:
- Large refining and fertiliser demand
- Significant renewable-energy resources
- Industrial demand centres
- Policy interest in reducing fossil-fuel imports
- Opportunities in ammonia, methanol and steel
But these advantages do not remove project risks. Indian projects should be evaluated using questions such as:
- Is renewable power available at the required load factor?
- Will grid charges and open-access regulations remain stable?
- Is water availability socially and environmentally sustainable?
- Who bears the risk of electrolyser degradation?
- Is the refinery or fertiliser buyer contractually committed?
- Is the hydrogen-price formula linked to electricity, gas or carbon prices?
- Are production and offtake facilities located close enough to avoid excessive transport costs?
- What happens if incentives are delayed?
- Can the project survive lower-than-planned utilisation?
- Is the product compliant with both Indian and export-market emissions standards?
Project selection should favour strong existing industrial demand over speculative applications whose entire value chain must be created simultaneously.
What the IEA Database Does Well
The database should not be dismissed. It provides visibility into:
- Geographic concentration
- Production technologies
- Project development stages
- Planned capacities
- Infrastructure requirements
- Trade orientation
- Changes in project pipelines over time
The IEA has also been explicit about the sector’s limitations. It reports that investment momentum slowed in 2025, new final investment decisions declined, the project pipeline contracted and only China and the Netherlands were on track to meet national 2030 targets.
The report also recognises that demand remains the missing component and that low-emissions hydrogen is not yet available at sufficient scale to solve immediate energy-security pressures.
Therefore, the primary risk is not necessarily incorrect IEA reporting. The risk is selective interpretation by governments, investors, consultants and promoters who publicise the announced pipeline while ignoring the IEA’s warnings concerning cost, demand, infrastructure and project attrition.
Conclusion: Treat the Database as a Map of Hypotheses
The IEA Hydrogen Production and Infrastructure Projects Database is a useful map of global hydrogen ambition. But ambition is not production. Production is not reliable supply. Reliable supply is not automatically bankable demand. Bankable demand is not proof of unsubsidised competitiveness. And a technically operating project is not automatically a genuinely low-emissions project.
The database should therefore be treated as a collection of hypotheses:
- This project may be financed.
- This electrolyser may be constructed.
- This customer may purchase the output.
- This infrastructure may be available.
- This hydrogen may reduce emissions.
- This business model may remain viable.
Each hypothesis requires a measurable failure condition.
The strongest hydrogen strategy will not be the one that announces the most projects. It will be the one that quickly identifies weak projects, stops protecting optimistic assumptions, closes interface risks and directs capital towards applications where hydrogen provides a demonstrable system-level advantage.
The real measure of progress is not the number of projects entering the database. It is the number that survive contact with financing, engineering, customers, infrastructure, operations and reality.
References
1. International Energy Agency, Hydrogen Production and Infrastructure Projects Database, updated June 2026. https://www.iea.org/data-and-statistics/data-product/hydrogen-production-and-infrastructure-projects-database
2. International Energy Agency, Global Hydrogen Review 2026, published 18 June 2026. https://www.iea.org/reports/global-hydrogen-review-2026
3. International Energy Agency, Global Hydrogen Review 2026 – Executive Summary. https://www.iea.org/reports/global-hydrogen-review-2026/executive-summary
4. International Energy Agency, Global Hydrogen Review 2026 – Production. https://www.iea.org/reports/global-hydrogen-review-2026/production
5. International Energy Agency, Global Hydrogen Review 2026 – Demand. https://www.iea.org/reports/global-hydrogen-review-2026/demand
6. International Energy Agency, Global Hydrogen Review 2026 – Cost Acceptability. https://www.iea.org/reports/global-hydrogen-review-2026/cost-acceptability
7. International Energy Agency, Global Hydrogen Review 2026 – Trade and Infrastructure. https://www.iea.org/reports/global-hydrogen-review-2026/trade-and-infrastructure
8. International Energy Agency, Global Hydrogen Review 2026 – Investment and Innovation. https://www.iea.org/reports/global-hydrogen-review-2026/investment-and-innovation