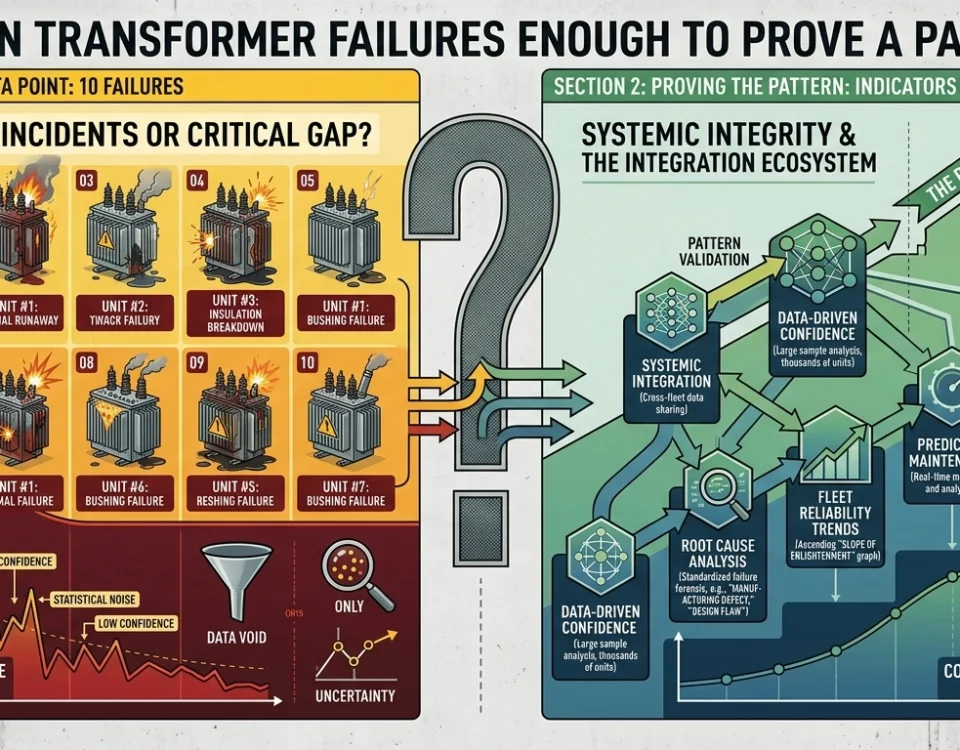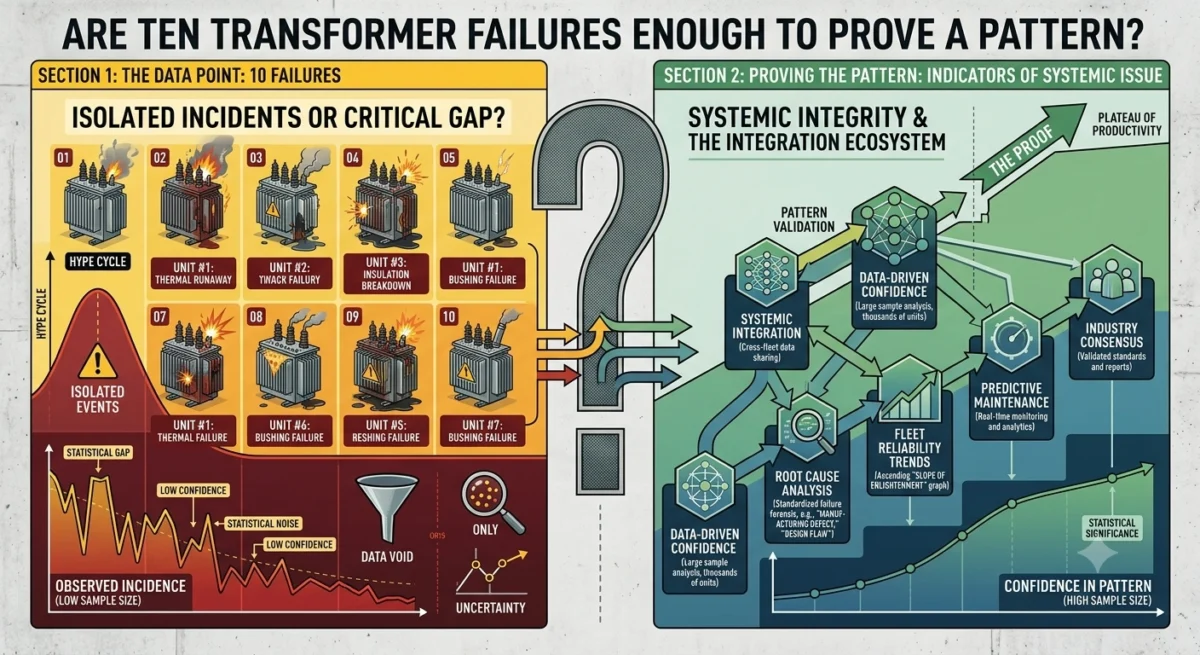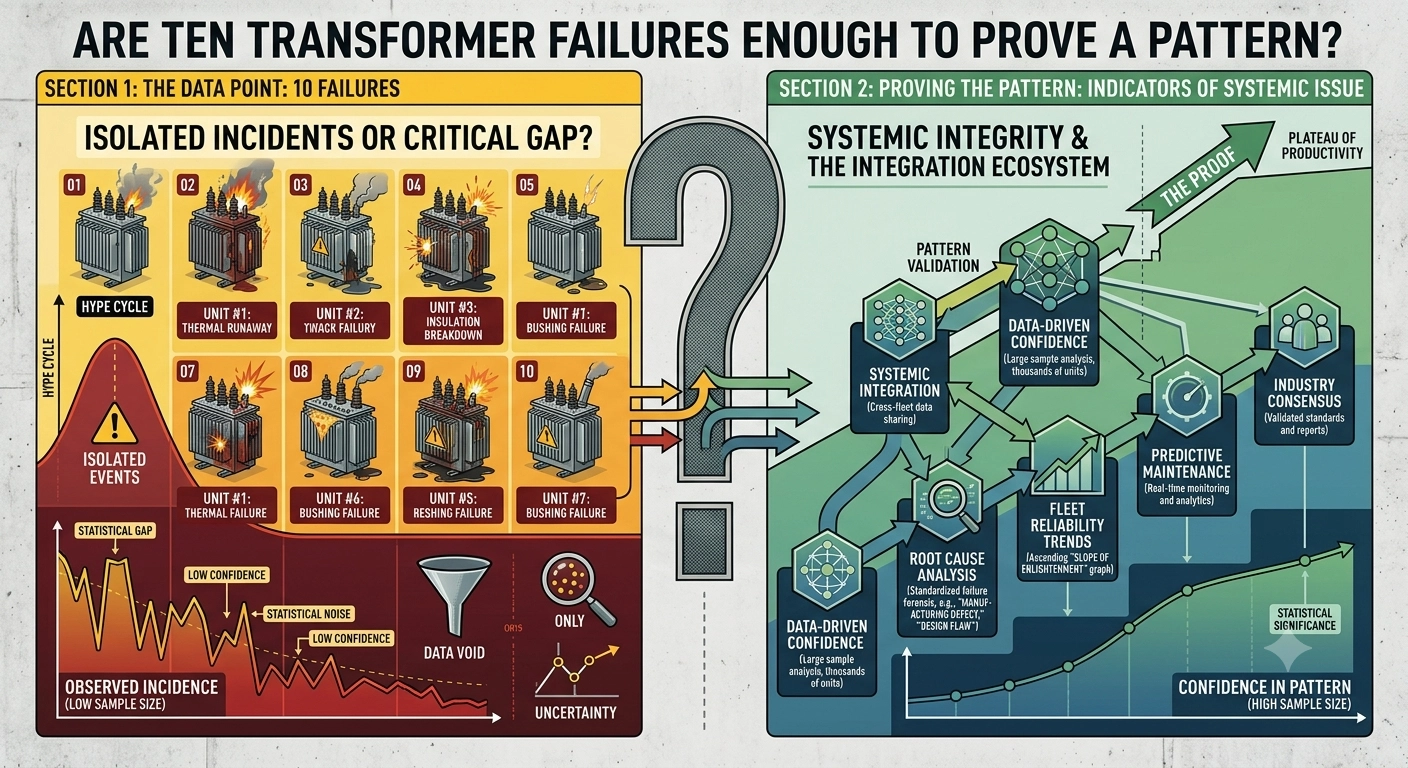
The Central Electricity Authority’s agenda for its Standing Committee on Substation Equipment Failure contains detailed case information on nine transformer failures and one reactor failure reported during January-June 2026. The document is valuable. But what, exactly, can it prove?
This question matters because engineers and managers often confuse a collection of serious incidents with a statistically representative reliability study. The two are not the same.
Ten failures can generate important hypotheses. They cannot, by themselves, establish national failure rates or prove which design, manufacturer or maintenance practice is riskier.
The central verdict
The report is strong as an engineering and forensic record, but weak to moderate as a statistically powered study. It can identify possible mechanisms, weak signals and recurring investigation gaps. It cannot reliably estimate failure probability, compare manufacturers, or generalise causal conclusions to the wider transformer population.
| Dimension | Assessment |
| Engineering diagnostic value | 8/10 |
| Failure-mechanism information | 7/10 |
| Statistical descriptive value | 4/10 |
| Ability to estimate failure probability | 2/10 |
| Ability to compare manufacturers | 1/10 |
| Ability to prove causal factors | 2-3/10 |
| Value for building a future reliability database | 9/10 |
The missing denominator
The document tells us how many units failed. It does not tell us how many comparable units were operating without failure. That missing denominator is the report’s most important statistical limitation.
Failure rate = Number of failures / Total comparable exposure
If four failed units came from a manufacturer with only forty comparable units in service, that signal would look very different from four failures among four thousand transformer-years of
exposure. Without fleet size, service years, loading history and surviving-unit data, raw counts can mislead.
The same problem affects conclusions about age. The cases span equipment manufactured in very different years. That variety may suggest an age-related pattern, or it may merely reflect the age distribution of the installed fleet. The report does not provide enough information to distinguish the two.
What Kahneman and Tversky would warn us about
1. Availability bias
A ruptured bushing, burnt reactor, tank bulging or high-energy arcing is vivid. Vivid events are easier to recall, so we instinctively overestimate how frequently their mechanisms occur. The severity of an incident should not be confused with the prevalence of its cause.
2. Base-rate neglect
Investigators may focus on characteristics of failed units – manufacturer, age, OLTC design, bushing type or maintenance history – without comparing them with the base rates in the healthy fleet. A characteristic that appears frequently among failures may simply be common among all installed transformers.
3. Outcome bias and hindsight
After a transformer fails, every prior observation receives new significance. A small tan-delta shift, a through-fault, a maintenance interval or a weather condition may suddenly look predictive. But a variable is only genuinely predictive if it separates failed units from comparable units that remained healthy.
4. The narrative fallacy
Humans prefer a coherent story: a warning sign was missed, a component weakened, protection operated and failure followed. Such a story may be plausible and still be wrong. Statistical confidence requires competing explanations and evidence capable of discriminating between them.
What Popper would ask us to falsify
Karl Popper’s approach changes the investigation question. Instead of asking, ‘What evidence supports our explanation?’ we ask, ‘What observation would make us reject it?’
| Hypothesis | Supporting observation | Falsification test |
| Poor maintenance causes failure | A failed unit had inadequate inspection or an unresolved abnormality. | Find comparable failed units with recent normal maintenance, and healthy units with poorer maintenance. |
| Through-fault exposure drives failure | A failed transformer experienced repeated or severe through-faults. | Compare with transformers exposed to similar through-fault counts and magnitudes that did not fail. |
| Age is the primary driver | Older transformers appear among the failures. | Calculate age-specific failure rates using the full installed population and transformer-years. |
| A manufacturer or design is riskier | Several failed units share a make or design family. | Compare failures per unit-year after controlling for fleet size, age, duty and application. |
Failure mode is not always root cause
Terms such as ‘inter-turn fault’, ‘internal fault’, ‘OLTC failure’, ‘busbar flashover’ or ‘bushing failure’ may describe what failed or where the event manifested. They do not always explain why the insulation, mechanism or structural system lost its required function.
For example, an inter-turn fault invites further questions: Was insulation degraded thermally? Was there winding movement after a through-fault? Was moisture involved? Did manufacturing variability, contamination, overvoltage or transport damage contribute? A rigorous investigation keeps these competing hypotheses open until evidence eliminates them.
Missing and uneven data reduce causal confidence
The case forms contain useful fields, but several responses are blank, marked ‘NA’, described as ‘under progress’, or refer to attachments not contained in the agenda. In some cases the OEM did not inspect the unit. In others, destructive damage prevented testing. Therefore, all listed ‘probable causes’ should not be treated as equally certain.
A better classification would explicitly grade causal confidence:
- Confirmed
- Highly probable
- Probable
- Possible
- Unknown
Why the recommendations may still be sensible
Low statistical power does not mean the report has low engineering value. Transformer failures are low-frequency, high-consequence events. Actions such as condition monitoring, SFRA after significant through-faults or movement, bushing tan-delta and capacitance measurements, DGA, OEM feedback and residual-life assessment can be justified as precautionary controls even before a conventional significance test is available.
The decision rule should consider not only statistical certainty, but also the severity of failure, the cost of monitoring, the reversibility of the action and the consequences of being wrong.
What would make the national dataset statistically powerful?
The next step is not merely to collect more failure reports. It is to build an exposure-and-outcome database that also includes transformers that did not fail.
- OEM, design family, manufacturing year and batch
- Voltage class, MVA rating and application
- Commissioning date and transformer-years in service
- Loading, overload and thermal history
- Number and severity of through-faults
- DGA, moisture, tan-delta, capacitance and SFRA trends
- OLTC operations, defects and maintenance interventions
- Bushing make, technology, age and replacement history
- Protection events and disturbance records
- Physical root cause and causal-confidence grade
- Healthy units observed over the same period
With these data, analysts could estimate failures per transformer-year, build survival models, compare hazard rates and test whether factors such as repeated through-faults, age, loading or bushing design independently increase failure risk.
A practical critical-thinking test
| Kahneman-Tversky question | Popper question |
| Am I seeing a genuine pattern, or constructing a convincing story because I already know which units failed? | What evidence from transformers that did not fail would make me abandon this explanation? |
Conclusion
The CEA agenda should be viewed as a strong forensic and learning document, not as a statistically conclusive reliability study. Its cases are signals. They help identify possible failure mechanisms, investigation weaknesses and useful preventive controls. But they do not yet support national failure-rate estimates or causal comparisons among manufacturers, designs or maintenance practices.
The greatest opportunity is to connect each failure case with the much larger population of transformers that remain healthy. Only then can the sector move from compelling narratives to tested hypotheses, from incident counting to hazard estimation, and from static failure documentation to a living reliability system.
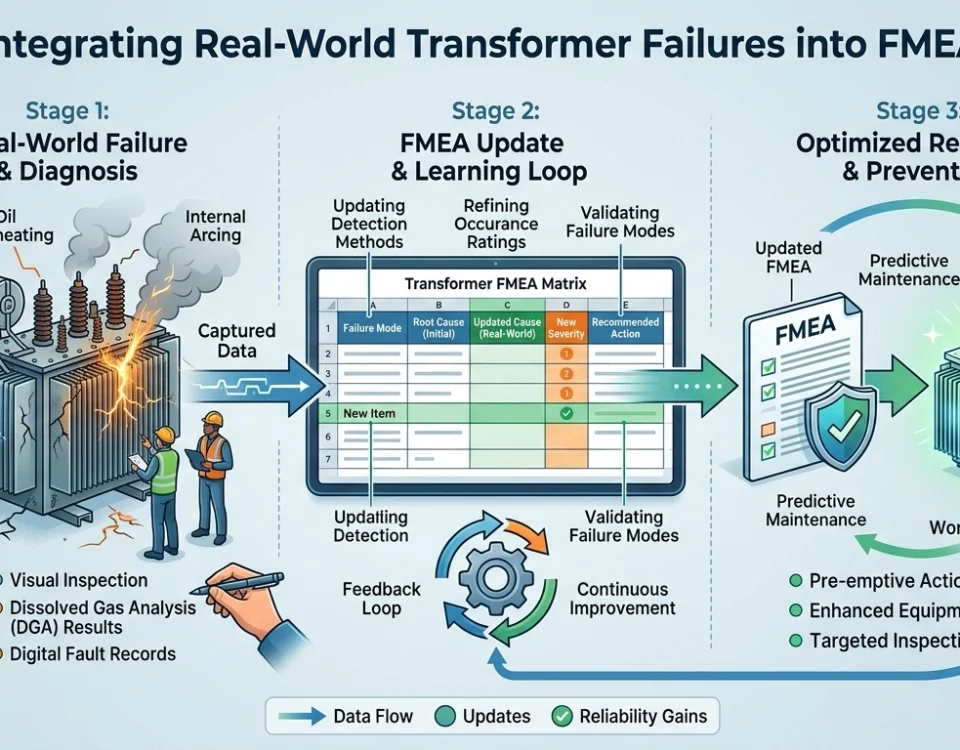
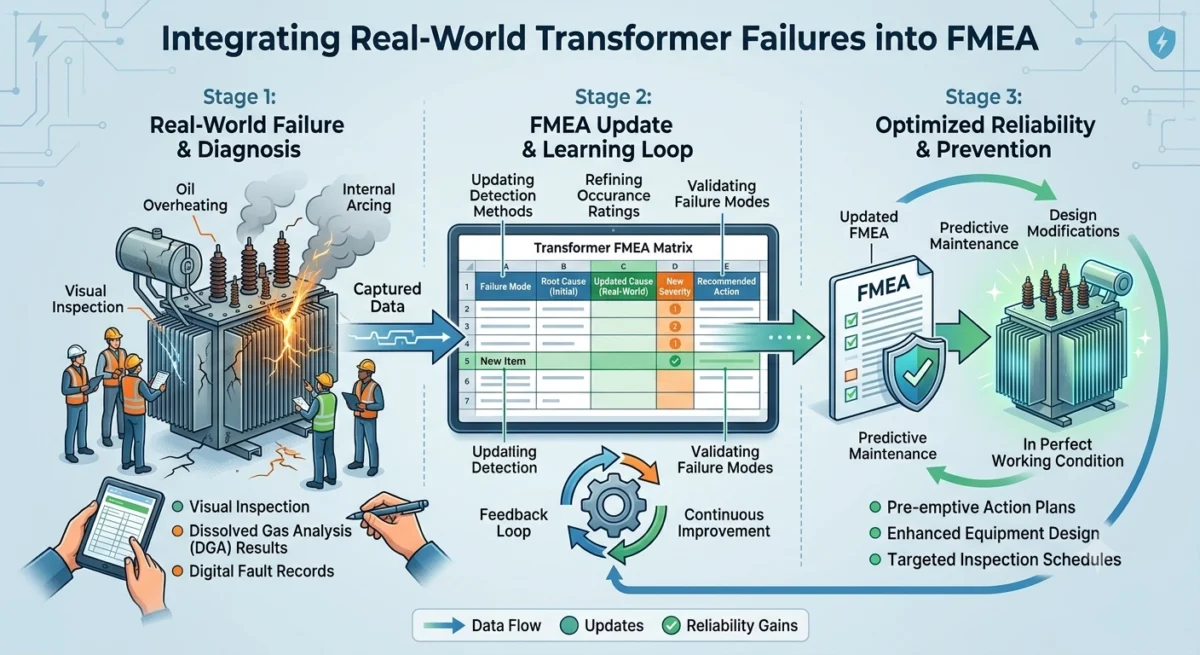
A living FMEA system should learn not only from what failed, but also from comparable equipment that faced similar stresses and survived.
Source note
This article is based on the Central Electricity Authority, Ministry of Power, agenda dated 25 July 2026 for the Standing Committee on Substation Equipment Failure concerning 220 kV-and-above transformer and reactor failures during January-June 2026. The source document lists nine transformer failures and one reactor failure and includes case-wise equipment, event, test, maintenance and probable-cause information.
Statistical interpretations in this article are analytical conclusions by the author. They are not stated conclusions of the CEA.